We at Aristotle Cloud Services feel strongly about the importance of metadata as a way of recording business knowledge. Metadata is the backbone of how we work with data, making sure whenever data is used it can be understood and used effectively. Part of sharing this enthusiasm is making sure that people can see how enterprise systems like the Aristotle Metadata Registry can be used to in innovative ways to make metadata more accessible to systems and to the people that use them.
This is why we’ve launched Aristotle Labs - a site where we can demonstrate new ways to use metadata to improve how people understand and interact with data. Aristotle Labs sits separate to the Aristotle Metadata Registry and is a place where we can explore and experiment with ways to make metadata more exciting and accessible and test new ideas, while also keeping our core products stable.
Along with the launch of Aristotle Labs, we’ve released our first new labs project - the Aristotle COVID-19 Dashboard.
About the Aristotle COVID-19 Dashboard
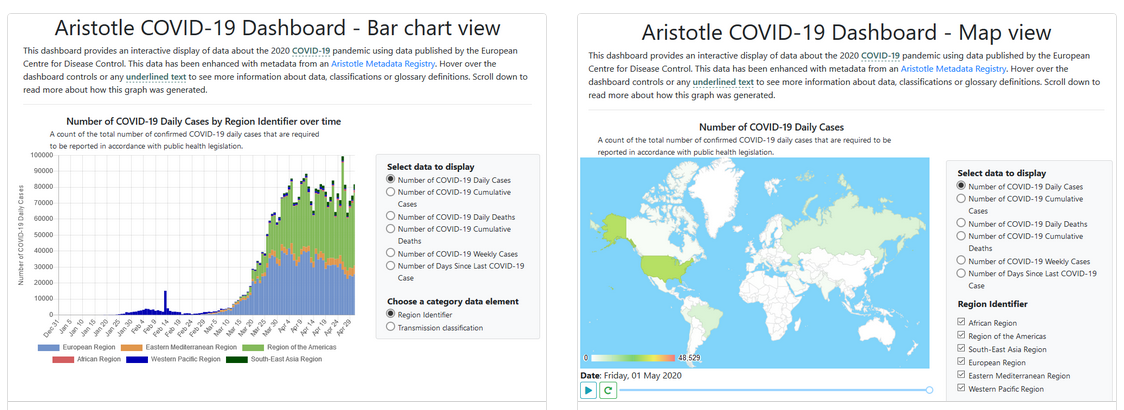
The Aristotle COVID-19 Dashboard provides an interactive display of data about the 2020 COVID-19 pandemic using data published by the European Centre for Disease Control. Like many data dashboards, ours presents data about the current 2020 COVID-19 pandemic as either a graph or a map. However, our data dashboard also includes a number of metadata-based enancements from our demonstration Aristotle Metadata Registry to give more context to the data. This includes metadata-driven generation of the interface and data selectors and automated discovery of the data files needed for the dashboard.

We examined World Health Organisation Situation Reports and case collection forms to gather details on how data about COVID-19 was collected and aggregated by the World Health Organisation before the data was published and entered this information into an Aristotle Metadata Registry to make the information available online in a central location.
The dashboard also includes a data lineage display that shows how data was collected by the World Health Organisation and how it was transformed before being made available. This diagram is dynamically updated based on the selected data and gives users of the data better context about where it came from and how it was collected. By making this data lineage information available in an interactive way we can show how metadata plays an important role in data literacy.

The dashboard also includes an interactive map that shows this data and metadata to help visualise the spread of COVID-19 across time to help people visualise the data and understand the impact across the globe.

These graphs are designed to display metadata to show important information about how the data is stored, including definitions codes and classifications, data types and business terminology. This metadata gives people the necessary details to accurately interpret data and without it, it can be difficult to determine what data means and where it has come from.
Future of Aristotle Labs
Throughout the year, along with our regular releases of new features from the Aristotle Product Roadmap we’ll be adding more projects to our labs to showcase more examples of how metadata can power interactive graphics, improve understanding and make metadata and exciting part of data management.
We are also sponsoring and presentation at the upcoming 6th Annual Government Data Summit to talk about how our clients can implement these features in enterprise business analytics tools like Tableau and Microsoft PowerBI. So if you are interested in learning about tools that can help build understanding around your data - log on and join in!